Recorded answers and observations give us information.
Show
Set out paper and a pencil. After the prediction, collect a game choice from everyone present. Write each name beside the choice.
Ask
Which game do you predict will receive the most choices?
Say
These words are data that help us choose a game. They describe the people we asked.
Used in
A canteen records food preferences to plan what to serve.
If your child says…“Words cannot be data.”
Ask
What do these words tell us about people's choices?
What’s true
Recorded choices give information even before anyone counts them.
2. Tally Marks and Frequency
Tallies track items; frequency gives each group's count.
Show
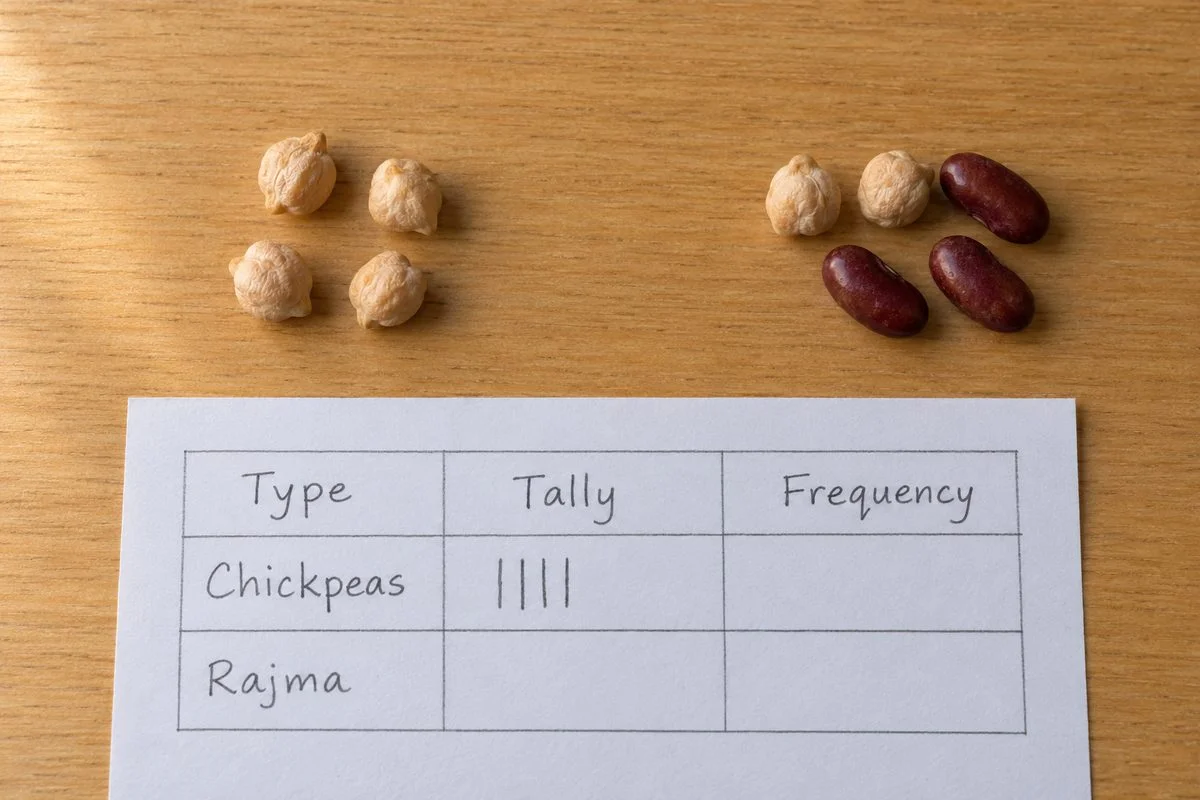
Mix six chickpeas and three rajma beans. Make columns headed Type, Tally and Frequency. Record each bean while moving it aside. Pause before recording the fifth chickpea, then finish after the prediction.
Ask
Where will you put the fifth chickpea stroke?
Say
Cross the four standing strokes with the fifth. Enter each total as its frequency.
Used in
Tallies help a scorer count votes without losing their place.
If your child says…“Five tallies need five standing lines.”
Ask
How many strokes will the crossed group contain?
What’s true
The fifth stroke crosses the earlier four, making a group easy to recognise.
Show and compare
3. Pictographs
Pictures show counts according to a key.
Show
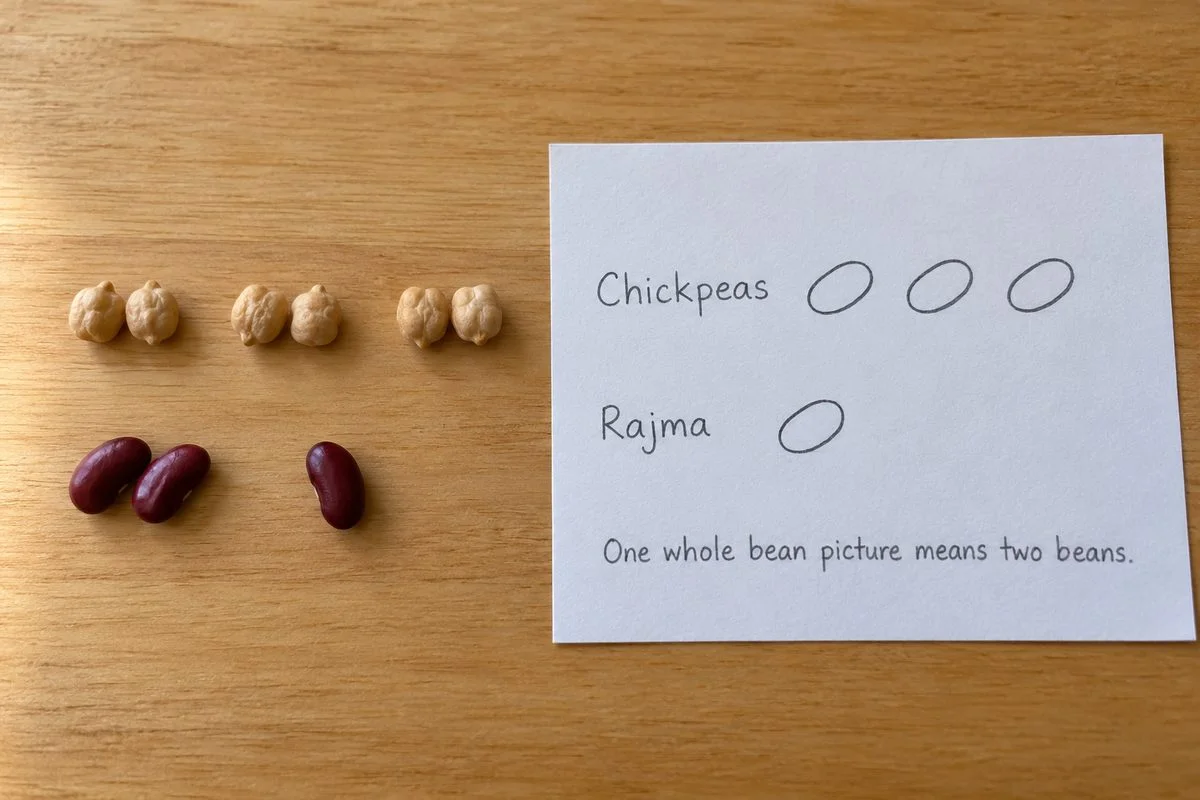
Pair the beans by type. Write a key: each whole bean picture means two beans. Label separate rows for chickpeas and rajma. Draw three chickpea pictures and one rajma picture.
Ask
What part of a picture will record the rajma bean left over?
Say
Add half a picture because a whole picture records two beans.
Used in
A recycling chart uses pictures to make collection totals easy to compare.
If your child says…“A half picture counts like a whole picture.”
Ask
Does the leftover bean fill a pair?
What’s true
A half picture records half the quantity given by the key.
4. Drawing a Bar Graph
Bars turn table counts into lengths using a scale.
Show
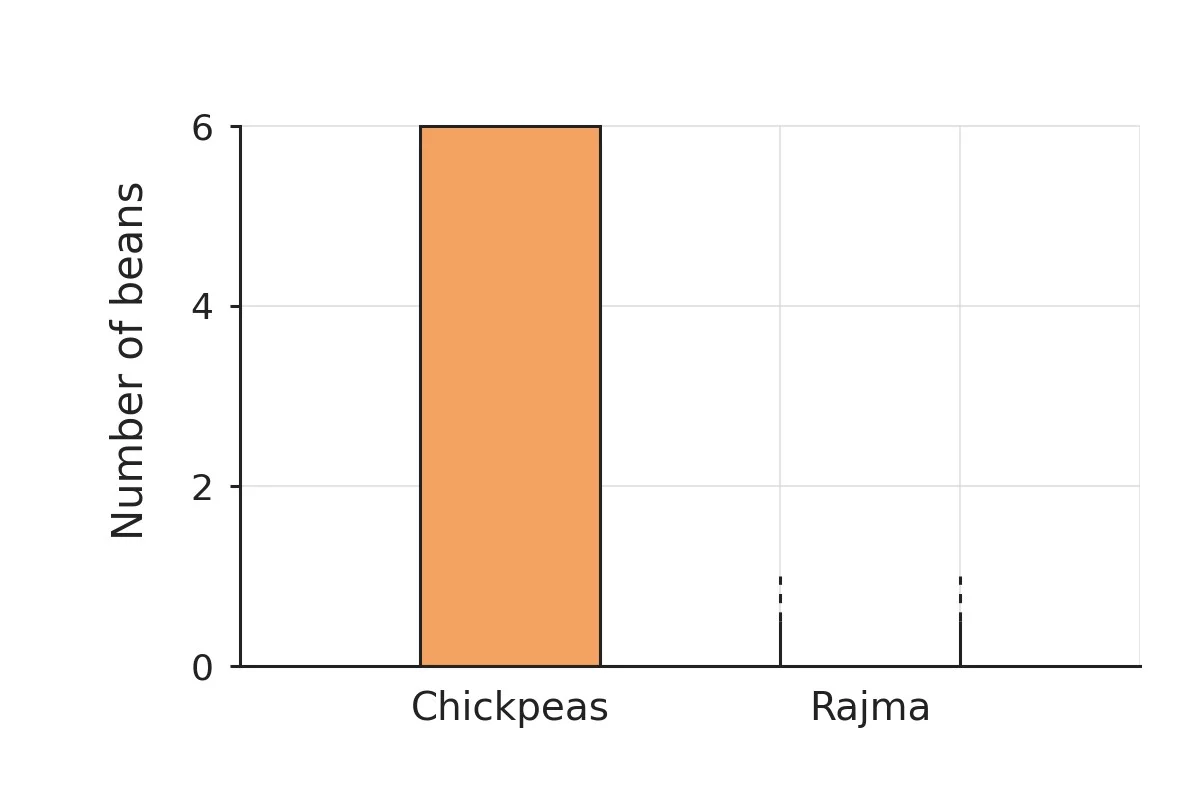
Compare the bean table with the diagram. Find what each square represents, then locate the unfinished rajma bar.
Ask
Where should the rajma bar end?
Say
Each square means two beans, so rajma reaches halfway between 2 and 4. Check both heights against the table.
Used in
Rainfall charts help compare how much rain different months received.
If your child says…“Each square always means one bean.”
Ask
What count does the first step above zero show?
What’s true
The chosen scale tells how many beans each square of height represents.
5. Artistic and Aesthetic Considerations
Clear displays make comparisons fair and easy.
Show
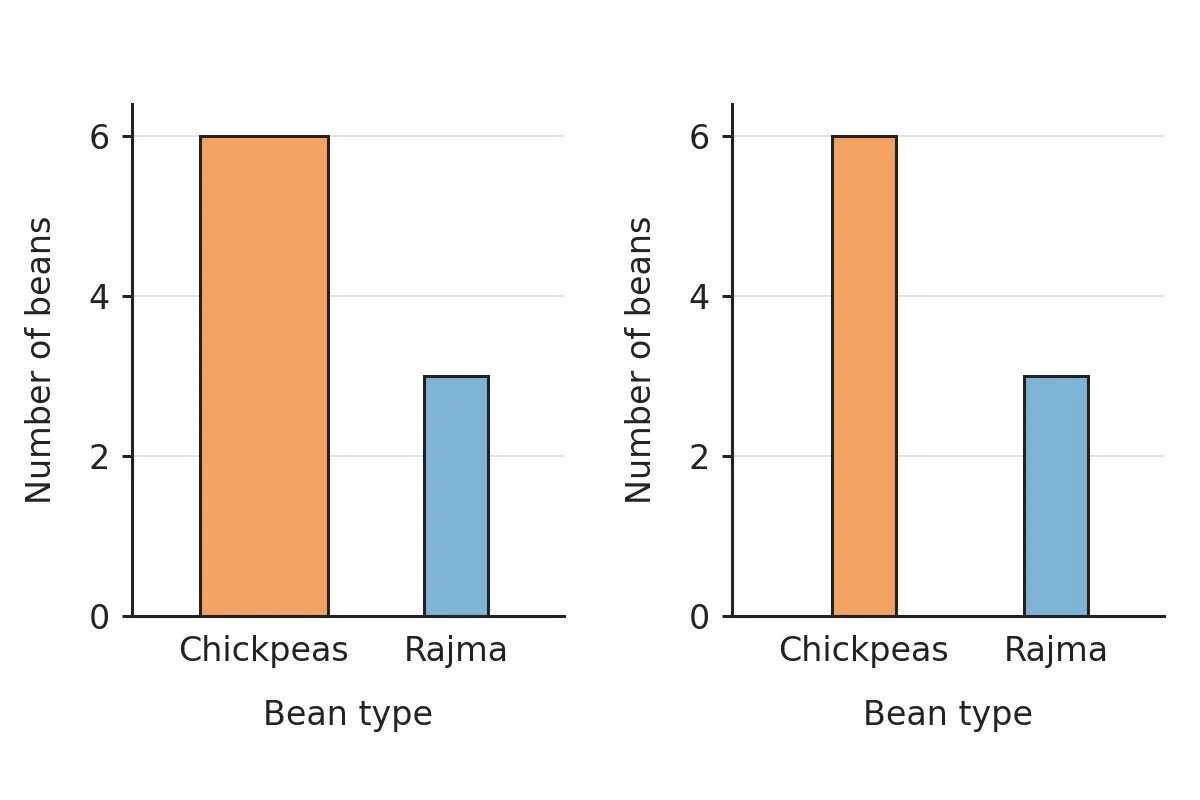
Look at the diagram. Compare the chickpea bars' widths, then follow their tops to the numbered scales.
Ask
Will the wider chickpea bar show a larger count?
Say
Both graphs show six chickpeas and three rajma beans.
Used in
Clear distance charts help travellers compare route lengths.
If your child says…“The bigger-looking picture must mean a greater height.”
Ask
Do the chickpea bars reach different numbers on the scales?
What’s true
Extra width makes a bar look bigger without adding any height.
A real problem
Survey data supported national planning.
India’s National Sample Survey began in 1950.
It was set up to fill information gaps for planning and policy.
Its data supported poverty estimates and policies.
We use cookies, including Meta’s and, if a ChatGPT advert brought
you, OpenAI’s, to see how visitors find us.
They are never used on your child’s screens in the app. You can turn them
off here, and change your mind any time.
Privacy policy