Skip to content

Teach Statistics in five steps.

For each idea: show it, ask before you tell, then say one line.

Gather plain paper, a pencil and twenty dry chickpeas.

Common misconceptions & worked visual for this chapter · 15 practice questions with answers

Why it matters

  • Average waiting times help people plan how long a visit might take.
  • The most frequently sold shoe size helps shops decide what to stock.
  • Median household income gives the middle of ordered incomes. It can differ from the mean.

What to teach

How to teach it

Mean and mode

xˉ=1+3+5+54\bar{x}=\frac{1+3+5+5}{4}

xˉ=1×1+1×3+2×51+1+2\bar{x}=\frac{1\times1+1\times3+2\times5}{1+1+2}

xˉ=144\bar{x}=\frac{14}{4}

1. Mean of Grouped Data

Each midpoint counts once per observation when we estimate the mean.

Show
Write minutes 0–2, 2–4, 4–6; counts 1, 1, 2. Write these lines. Say, “Midpoints replace unknown times; x-bar means estimated mean.”
Ask
From these counts and midpoints, what average waiting time do you expect?
Say
The estimate is 3.5 minutes.
Used in
Mean water use helps households plan supplies.
If your child says…“There are three rows, so I divide by three.”
Ask
How many people do these three rows count altogether?
What’s true
These three rows represent four people, so divide the estimated total by four.
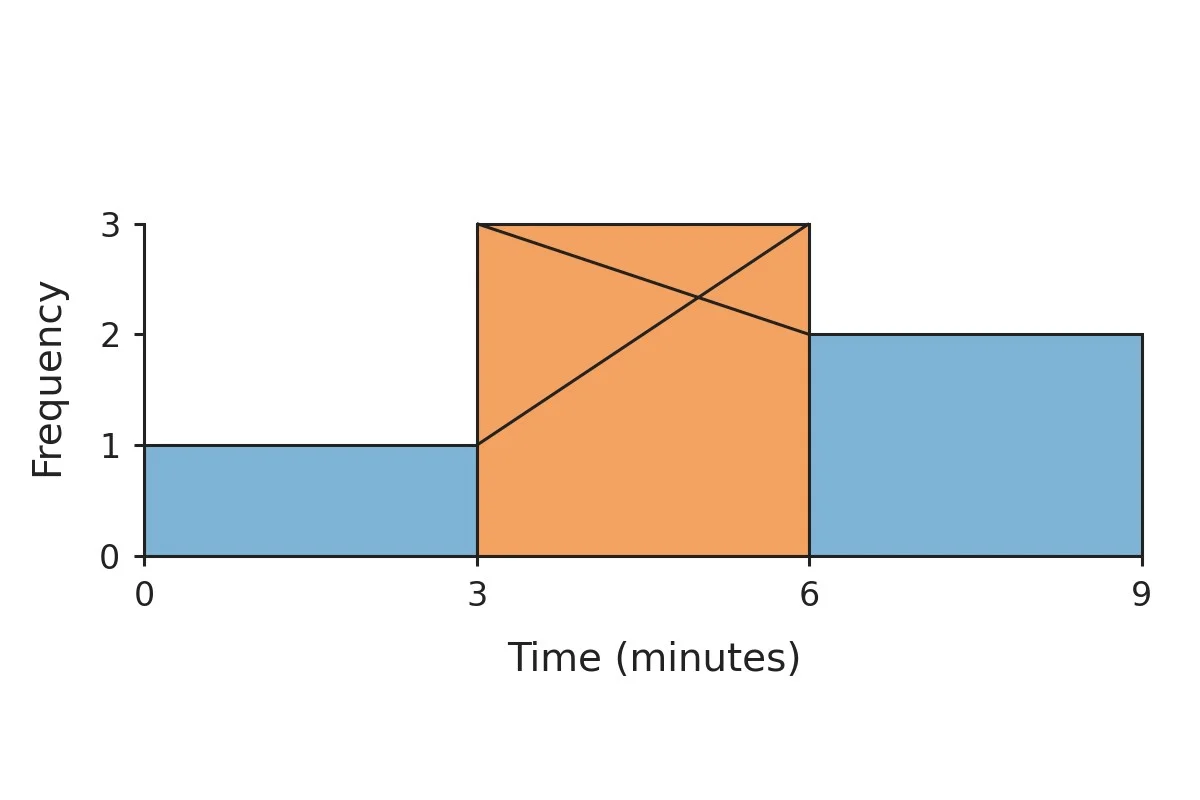
Three touching histogram bars with two crossing lines inside the tallest middle bar.

2. Mode of Grouped Data

The grouped mode estimates the most common value.

Show
Find the tallest bar in the diagram. Compare its height with the bars immediately before and after it.
Ask
From these bar heights, where inside the tallest bar do you expect the estimated mode?
Say
It is two-thirds of the width into the bar: Mode=3+22+1×3=5\mathrm{Mode}=3+\frac{2}{2+1}\times3=5 minutes.
Used in
The most common clothing size helps shops plan stock.
If your child says…“The tallest bar is three, so the mode is three minutes.”
Ask
Does the vertical scale measure people or minutes?
What’s true
Bar height counts people, while the horizontal position gives their waiting time.

Finding the middle

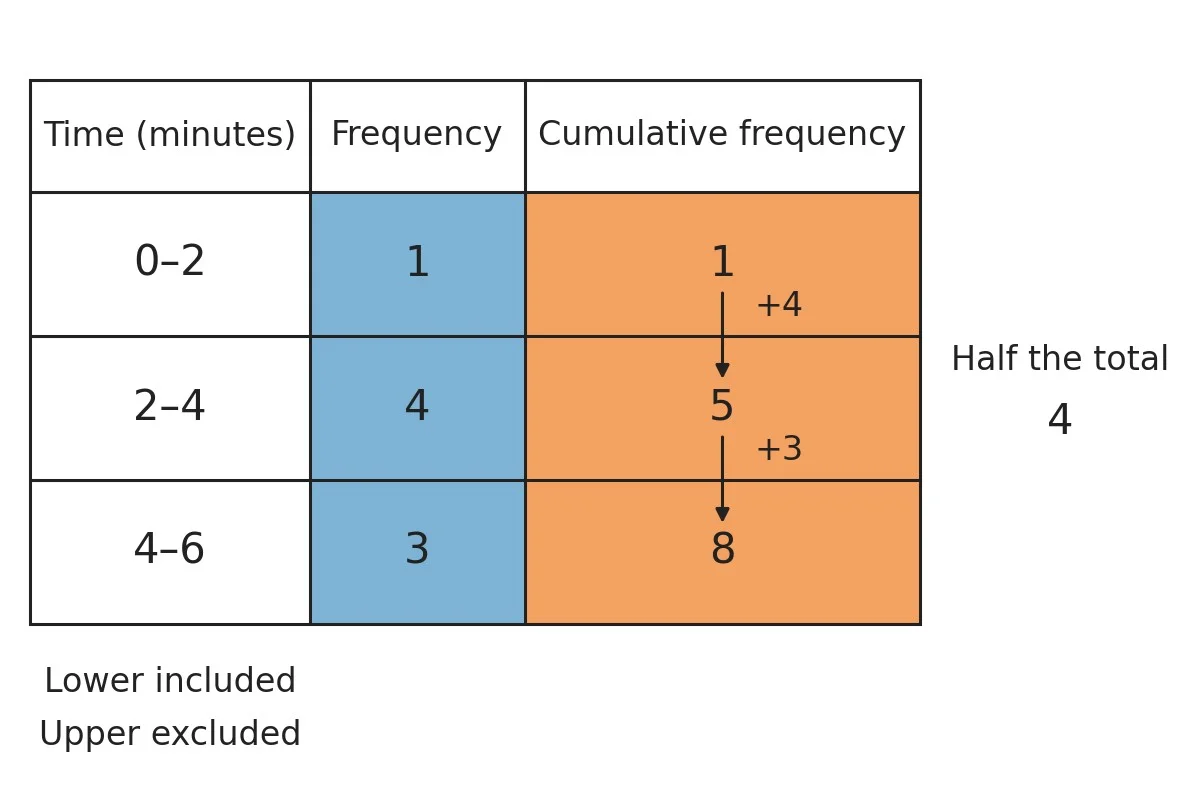
Waiting-time table with class counts and arrows connecting running totals.

3. Cumulative Frequency and Median Class

Running counts locate the middle class.

Show
Look at the diagram’s class counts. Follow the arrows down the running totals.
Ask
From these class counts, which interval do you expect to contain the middle two waits?
Say
The median class is 2–4 minutes because its running total first exceeds four. Each running total counts waits below that row’s upper boundary.
Used in
Cumulative delivery counts track parcels arriving before deadlines.
If your child says…“No class count exceeds four, so there is no median class.”
Ask
How many waits have you counted altogether by the end of each class?
What’s true
The middle position counts waits across earlier classes too.
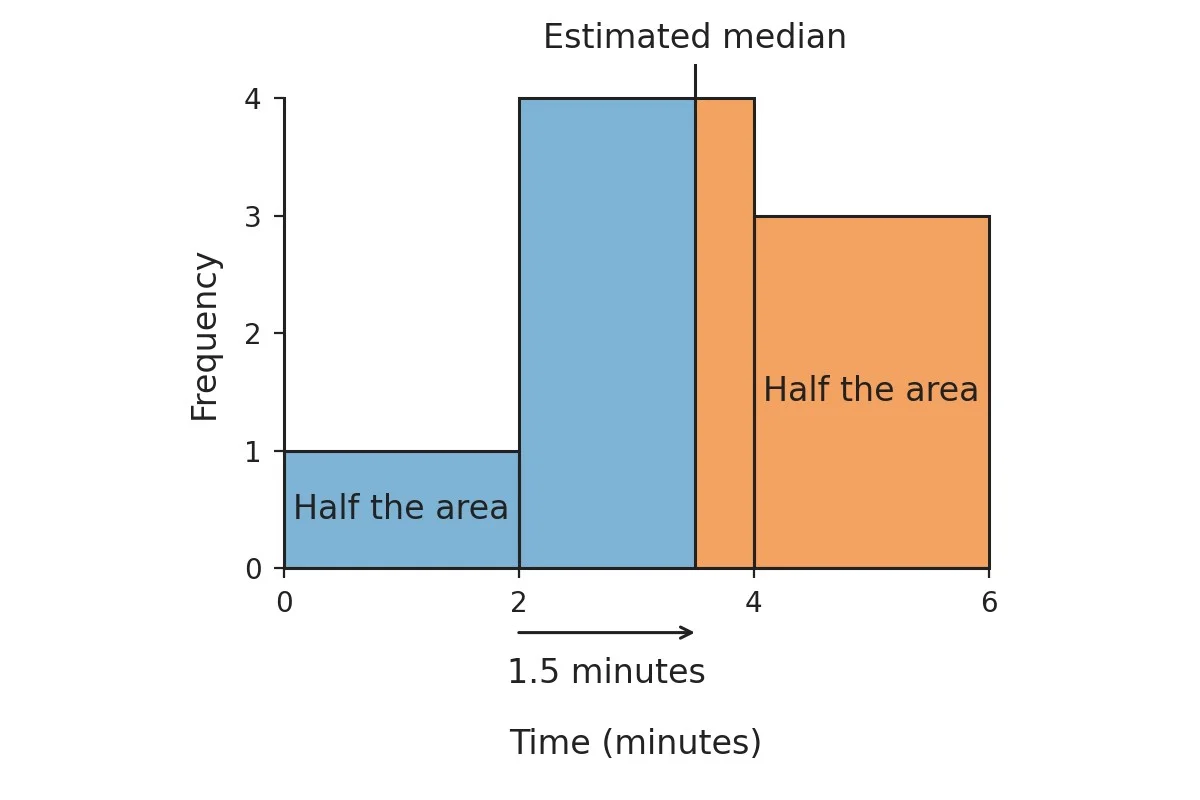
Histogram divided into equal areas, with an arrow showing distance within the middle class.

4. Median of Grouped Data

The grouped median estimates the middle value of the ordered data.

Show
Look at the diagram’s equal-width bars. Compare the bars before reading the dividing line and arrow.
Ask
Where do you expect the line that divides the total bar area into equal halves?
Say
Assuming evenly spread waits within the middle class, the estimated median is 3.5 minutes. The first bar supplies one of the four waits needed. Three-quarters of the next bar’s two-minute width adds 1.5 minutes.
Used in
Median house prices resist unusually expensive sales.
If your child says…“I can add three-quarters straight to the class's start.”
Ask
How many minutes is three-quarters of this two-minute interval?
What’s true
Multiply the fraction by the class width to turn it into minutes.

Choosing an average

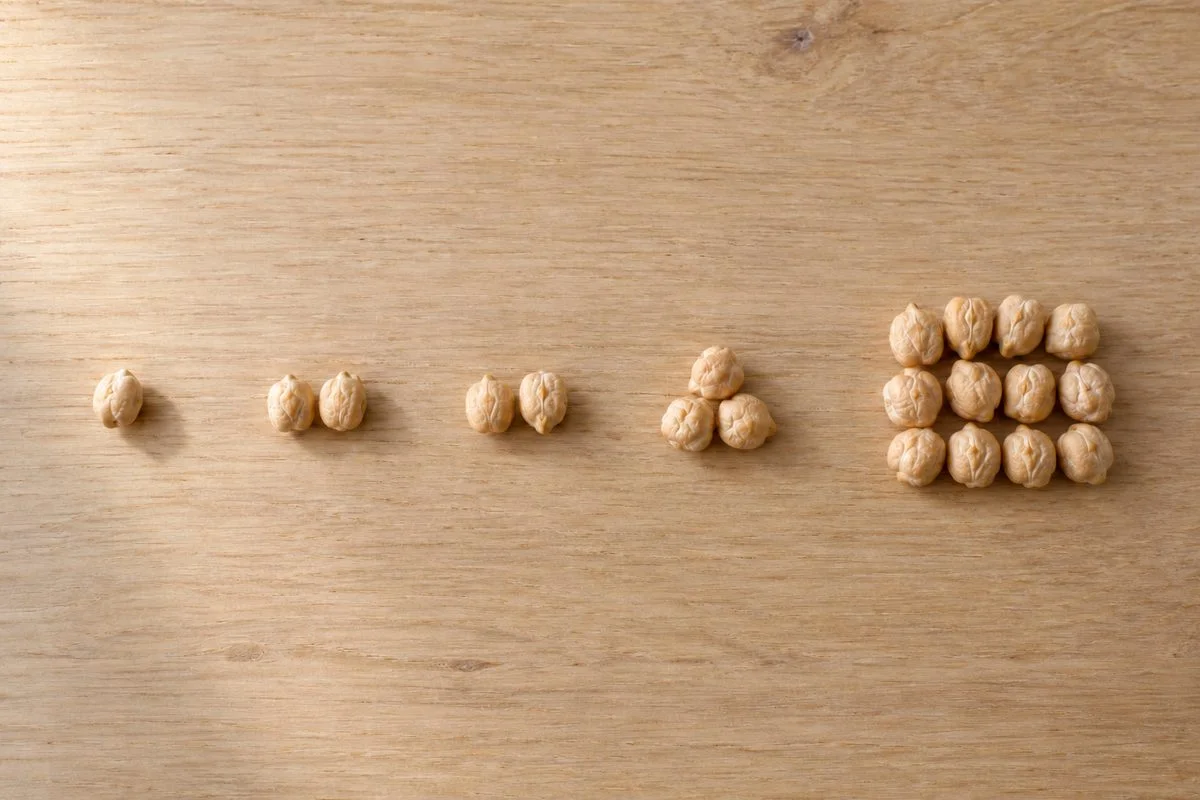
Five chickpea piles, with one pile much larger than the others.

5. Mean, Median and Mode

Mean gives equal shares. Median gives the middle. Mode occurs most often.

Show
Make chickpea piles of 1, 2, 2, 3, 12. Record counts; identify middle and most repeated. After predicting, share equally.
Ask
Will equal shares match the middle?
Say
Mean is 4; median and mode are 2.
Used in
Mean and median spending reveal unusually large purchases' effects.
If your child says…“The mean always tells us the most common amount.”
Ask
Which original pile had the equal-share count of four?
What’s true
Here, four is the equal share; two is the most frequent original pile size.

A real problem

A crowd's weight guesses produced a close average.

Galton investigated a livestock-fair guessing contest in 1906.

He chose the middlemost estimate, the median, as the crowd's answer.

The median guess closely matched the ox’s dressed weight.

Dressed weight means its weight after slaughter and preparation.

WikipediaNature, hosted by MITJohn Templeton Foundation

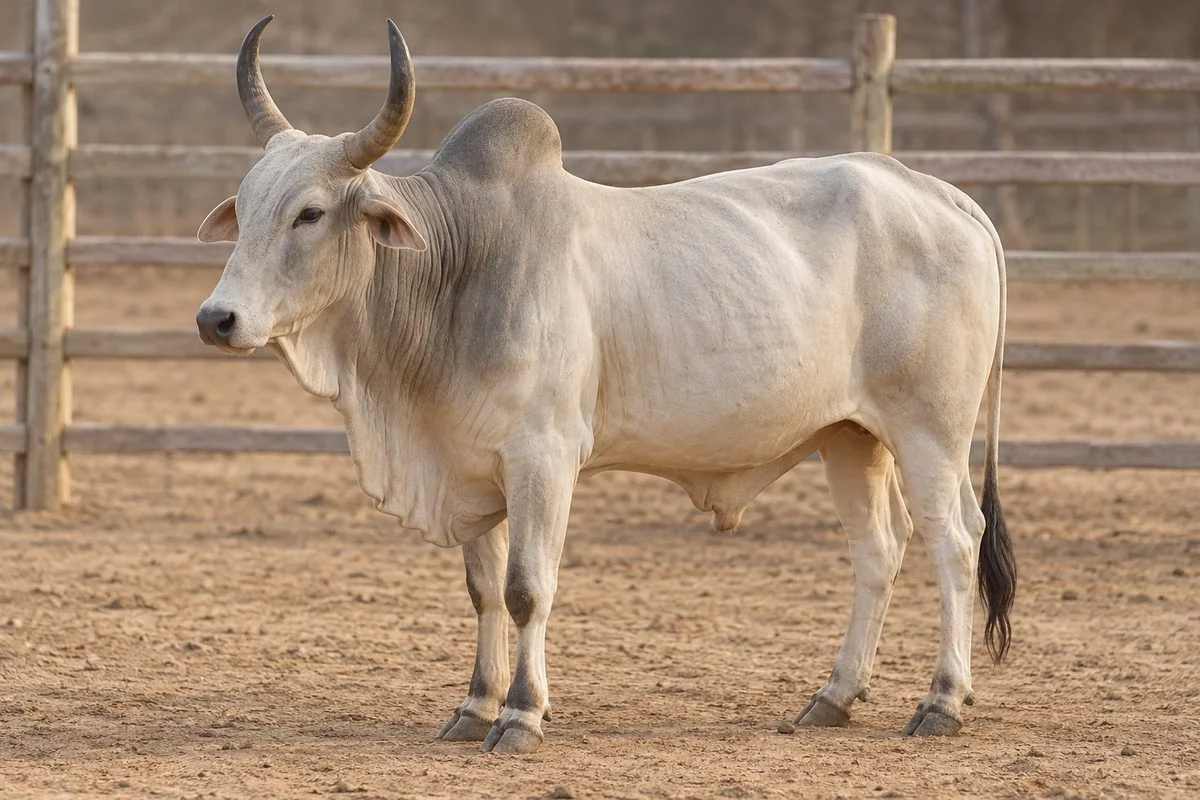
An ox standing in a simple livestock-fair enclosure.

Concept Lab · Common misconception

The tempting mistake in Statistics

Open standalone misconception page →

Can you ignore frequencies in the mean?

Wrong

If scores are 1 and 5, the mean is 3.

Why it feels right. I average the two score labels.

Right

Each score contributes as many times as it occurs.

Worked example

All scores
1
1
1
5
Average
Sum 8
4 students
2
The mean counts all four students. A score of 1 is counted three times.

If three students score 1 and one scores 5, the mean is (1 + 1 + 1 + 5) ÷ 4 = 2.

Ask your child five quick questions.

One per step. The answer and the reason are given.

  1. Which number should divide the estimated total here?

    Four. The rows describe four people, so each person contributes to the divisor.

  2. What does the tallest bar's height tell us here?

    Three people. Height gives the class count, not the estimated most common waiting time.

  3. Successive classes contain 4, 10, 7, 6 and 3 observations. Which class contains the middle?

    The third class. Running totals reach 14, then 21, crossing half the total of 30.

  4. How far into the 2–4 minute class does this calculation take us?

    1.5 minutes. Three-quarters of the two-minute width is 1.5 minutes.

  5. If the largest original pile gained five chickpeas, what would happen to the mode?

    It remains two chickpeas. Two still occurs most often because only the largest pile changes.

15 more questions with answers