
Skip to content

Teach Statistics in eight steps.

For each idea: show it, ask before you tell, then say one line.

Gather paper and a pencil.

Common misconceptions & worked visual for this chapter · 15 practice questions with answers

How to teach it

Seeing spread

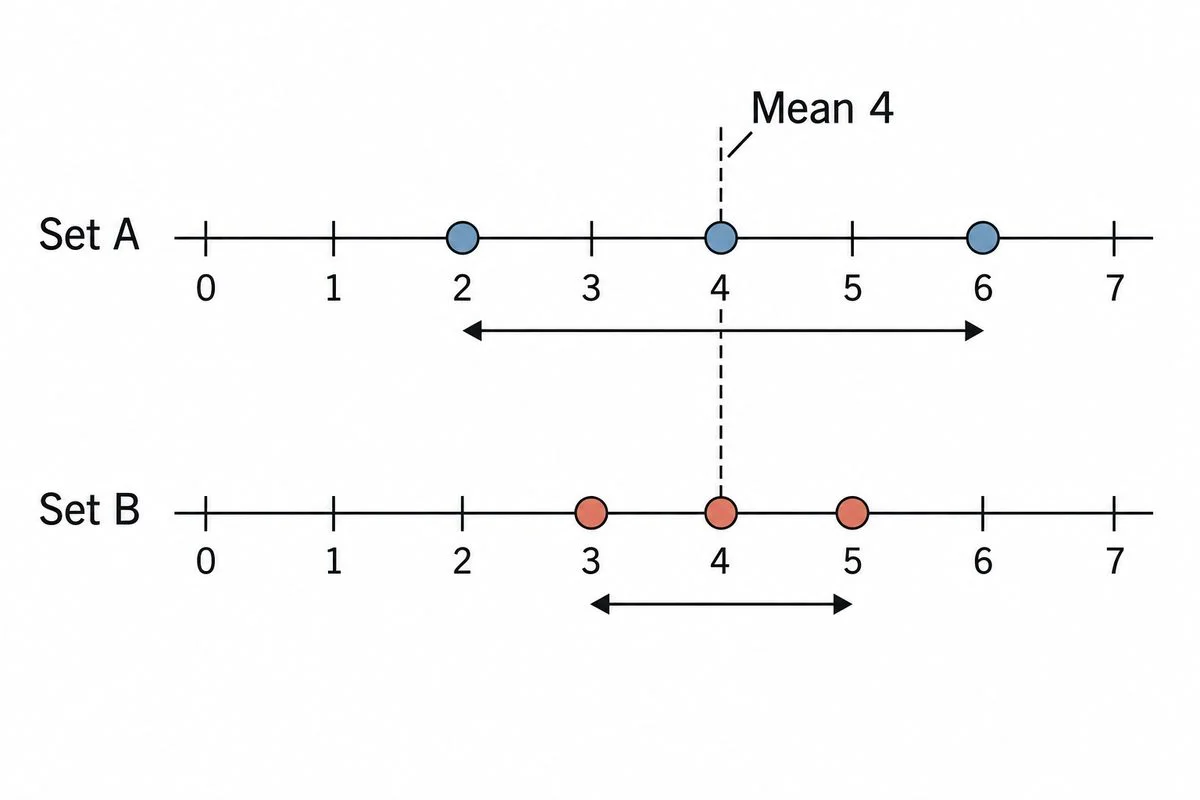
Two sets share mean 4 but have different gaps between their extremes.

1. Measures of dispersion and range

Spread shows variation; range measures the gap between extremes.

Show
Look at the diagram. Find the shared mean, 4, then compare the arrows joining each set's extremes.
Ask
With matching means, will these sets be equally consistent?
Say
Set B has range 2; Set A has range 4. Matching means do not guarantee matching spreads.
Used in
The largest clothing measurement minus the smallest gives the range. This helps makers compare size variation.
If your child says…“The same average means equally consistent values.”
Ask
Are the extreme dots equally far apart in both sets?
What’s true
An average does not tell us how far apart the values are.
Mean deviation

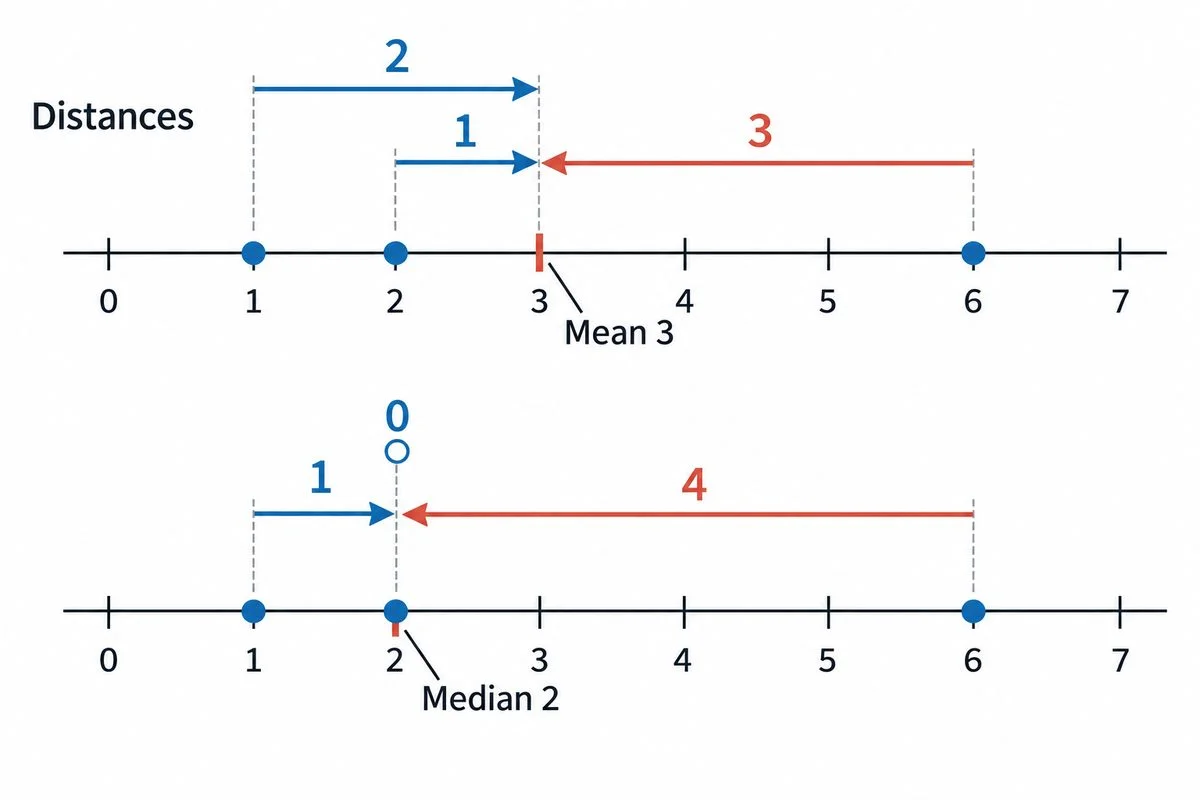
Distances from the same observations to their mean and median.

2. Mean deviation for ungrouped data

Average distance from a chosen centre.

Show
Look at the diagram's ordered values: 1, 2, 6. Compare distances from mean 3 and median 2, the middle value.
Ask
Will averaging the distances give the same result from each centre?
Say
The distances average 2 about the mean and 53\frac{5}{3} about the median.
Used in
Mean deviation describes water-use variation, helping plan supplies.
If your child says…“The differences cancel, so there is no spread.”
Ask
Do all the dots sit at the centre?
What’s true
Distances cannot cancel because each distance is non-negative.

xˉ=1(1)+3(3)4=2.5\bar{x}=\frac{1(1)+3(3)}{4}=2.5

M.D.(xˉ)=1∣1−2.5∣+3∣3−2.5∣4\mathrm{M.D.}(\bar{x})=\frac{1|1-2.5|+3|3-2.5|}{4}

3. Mean deviation for grouped data

Count repetitions; represent intervals by midpoints.

Show
Write these lines for intervals [0,2)[0,2) and [2,4)[2,4), with frequencies 1 and 3. Say: “Use midpoints 1 and 3. X-bar means mean; M.D. means mean deviation.”
Ask
What estimated mean deviation will the final division give?
Say
The estimate is 0.75.
Used in
Grouped delivery times help businesses estimate variation without listing every delivery.
If your child says…“There are two rows, so I divide by two.”
Ask
How many observations do the two frequencies count altogether?
What’s true
The divisor counts observations, including repetitions.

M.D.(3)=∣−2∣+∣2∣2=2\mathrm{M.D.}(3)=\frac{|-2|+|2|}{2}=2

∣(−2)+2∣2=0\frac{|(-2)+2|}{2}=0

σ2=(1−3)2+(5−3)22=4\sigma^2=\frac{(1-3)^2+(5-3)^2}{2}=4

4. Limitations of mean deviation

Absolute distances measure spread but make further algebra less convenient.

Show
Write this line for 1 and 5, whose mean is 3. Say: “M.D. means mean deviation. Adding the signed differences first gives zero. Squaring each difference and averaging gives variance 4.”
Ask
What will averaging squared readings and then subtracting the squared mean give?
Say
It also gives variance 4. Squaring allows this shortcut, while absolute values cannot simply move outside a sum.
Used in
Squared deviations simplify calculations when analysing variation in repeated measurements.
If your child says…“Distance bars work like ordinary brackets.”
Ask
Why does adding the signed differences first give a different answer?
What’s true
Taking absolute values before adding can differ from taking an absolute value after adding.

Variance and standard deviation

xˉ=1+1+1+1+65=2 cm\bar{x}=\frac{1+1+1+1+6}{5}=2\text{ cm}

(−1)+(−1)+(−1)+(−1)+4=0(-1)+(-1)+(-1)+(-1)+4=0

σ2=1+1+1+1+165=4 cm2\sigma^2=\frac{1+1+1+1+16}{5}=4\text{ cm}^2

5. Variance and standard deviation

Variance: average squared distance from the mean; standard deviation: non-negative square root.

Show
Write this line for recorded lengths 1, 1, 1, 1, 6 cm. Say: “The mean length is 2 cm. Four differences are −1 cm, and the fifth is 4 cm. They add to zero. Sigma-squared means variance.”
Ask
What standard deviation will describe this spread in centimetres?
Say
The standard deviation is 2 cm, the square root of variance 4 square centimetres. Squaring prevents cancellation, and taking the root restores centimetres.
Used in
Packet-weight standard deviations express variation in familiar grams.
If your child says…“The standard deviation also uses square centimetres.”
Ask
What happens to square centimetres when we take the square root?
What’s true
Taking the square root restores the measurements' original unit.

xˉ=1(0)+2(3)3=2\bar{x}=\frac{1(0)+2(3)}{3}=2

σ2=1(0−2)2+2(3−2)23=2\sigma^2=\frac{1(0-2)^2+2(3-2)^2}{3}=2

6. Standard deviation of a frequency distribution

Each occurrence contributes its own squared distance from the mean.

Show
Write this line for 0 occurring once and 3 occurring twice. Say: “The three readings total 6, so their mean is 2. Count both threes when averaging values and squared distances.”
Ask
What standard deviation follows from this frequency calculation?
Say
The standard deviation is 2\sqrt{2} because we root the variance.
Used in
Frequency tables summarise variation in production measurements, helping factories monitor consistency.
If your child says…“The squared distance for 3 only counts once.”
Ask
How many readings of 3 appear in the expanded list?
What’s true
Each occurrence contributes, so repeated values require repeated squared distances.

σx=22×1\sigma_x=\sqrt{2^2\times1}

σx=4\sigma_x=\sqrt{4}

7. Step-deviation method

Simplify readings, then restore centre and scale.

Show
Subtract 10 from readings 10, 14; halve to get 0, 2. Their mean and variance are 1. Write these lines. Say: “Sigma-x names original standard deviation.”
Ask
After doubling the simplified readings and adding 10, what will their standard deviation become?
Say
Standard deviation is 2: doubling doubles distances.
Used in
Step-deviation simplifies calculations with equally spaced class midpoints.
If your child says…“I must add the assumed centre back to the variance too.”
Ask
If a reading and its mean both rise equally, does their difference change?
What’s true
Adding the same number to every reading leaves spread unchanged. Multiplication changes standard deviation by the factor's absolute value, and variance by the factor squared.

σ2=102−(42)2\sigma^2=\frac{10}{2}-\left(\frac{4}{2}\right)^2

σ2=5−4\sigma^2=5-4

8. Correcting observations using mean and variance

Repair both totals before recalculating.

Show
Two readings have mean 3, variance 4. Replace recorded 5 with 3. Write these lines. Say: “Total six becomes four; square total twenty-six becomes ten. Sigma-squared means variance.”
Ask
What corrected variance comes next?
Say
Variance is 1. Replace squared contributions in the square total; the count stays unchanged.
Used in
Corrected sales summaries improve stock planning.
If your child says…“I'll subtract 5 and add 3 in both totals.”
Ask
Did the recorded 5 contribute 5 or its square to the square total?
What’s true
A square total needs squared contributions removed and replaced.

A real problem

Control charts help distinguish routine variation from unusual problems.

Telephone engineers needed more reliable transmission.

Shewhart proposed his control chart on May 16, 1924.

Control limits sit at multiples of the plotted quantity’s standard deviation from the centre line.

These limits help separate routine variation from variation caused by unusual problems.

American Society for QualityWikipediaNIST

An unbranded landline telephone on a plain desk.

Concept Lab · Common misconception

The tempting mistake in Statistics

Open standalone misconception page →

Does equal mean imply equal spread?

Wrong

Two sets with mean 5 must have the same spread.

Why it feels right. The mean is the number I use to describe a group.

Right

Spread measures how far values lie from the centre.

Worked example

Both groups balance at 5. Only Group B spreads to 1 and 9.
  1. The sets {5, 5, 5} and {1, 5, 9} both have mean 5.
  2. Their ranges are 0 and 8.

Ask your child eight quick questions.

One per step. The answer and the reason are given.

  1. Which set has the smaller range?

    The 3, 4, 5 set. Its extreme values are closer together, although both sets have the same average.

  2. Which distances count: those below the centre, above it, or both?

    Both. Both measure distance from the chosen centre, so neither is discarded.

  3. What number divides the total distance here?

    Four. The two rows together contain four observations.

  4. Why does taking absolute values after adding fail here?

    Opposite differences cancel. Taking each distance first preserves both contributions.

  5. What unit belongs to this standard deviation?

    Centimetres. The square root changes square centimetres back into centimetres.

  6. How many times must the squared distance for 3 count?

    Twice. Two observations have that value, and each contributes to variance.

  7. Which changes when 10 is added back: the mean or the variance?

    The mean. Adding equally to every reading leaves its distance from the mean unchanged.

  8. What replaces 525^2 in the square total?

    323^2. The replacement contributes its square because this total contains squared readings.

15 more questions with answers