Skip to content

Teach Tales by Dots and Lines in eight steps.

For each idea: show it, ask before you tell, then say one line.

Gather chickpeas, paper, a pencil and coloured pencils.

Common misconceptions & worked visual for this chapter · 15 practice questions with answers

Why it matters

  • Household spending records reveal when costs rise or fall.
  • Repeated measurements help show how much sizes vary.
  • Sunrise and sunset times tell us how much daylight is available.

What to teach

How to teach it

Understand averages

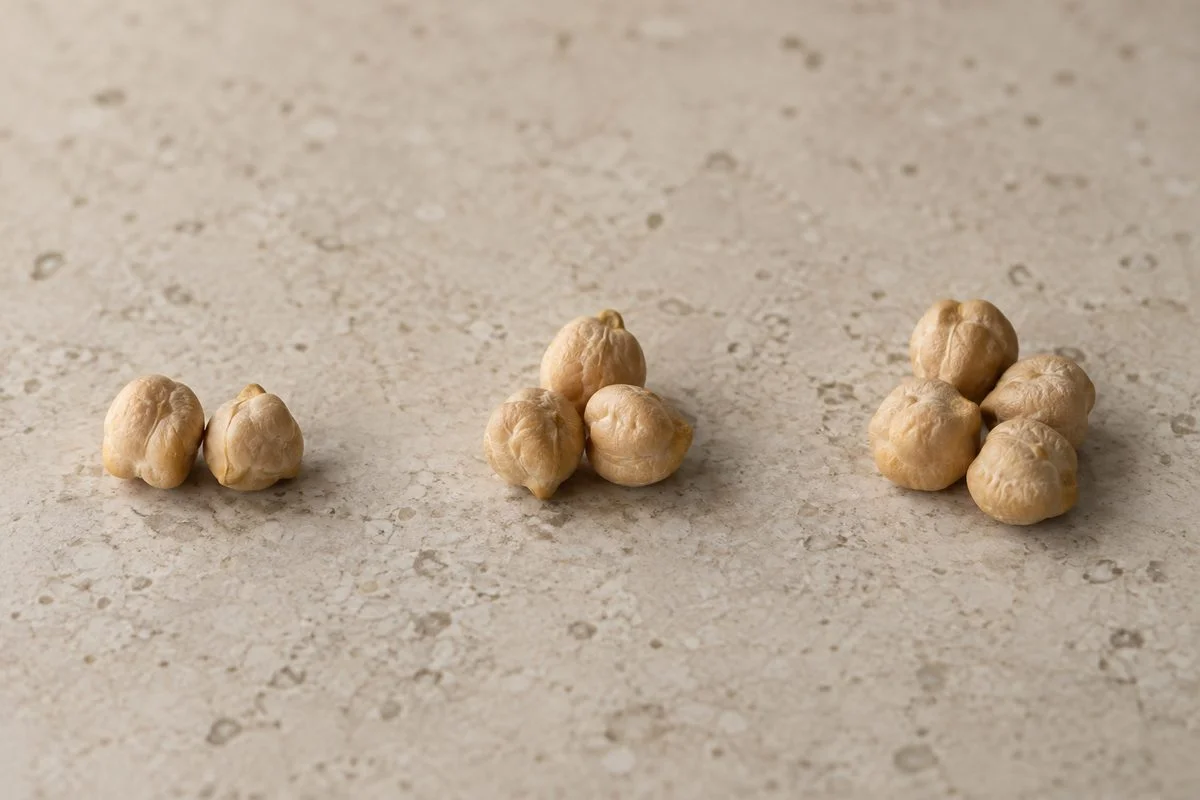
Three separate piles containing two, three and four chickpeas.

1. Arithmetic mean

The equal share.

Show
Make chickpea piles of 2, 3 and 4. Count them. After predicting, share equally.
Ask
How many will each pile get?
Say
Each pile gets 3 here.
Used in
Average water use helps households plan supplies.
If your child says…“The biggest pile gives the mean.”
Ask
Are there enough chickpeas to give every pile 4?
What’s true
The mean shares the whole collection equally across all piles.
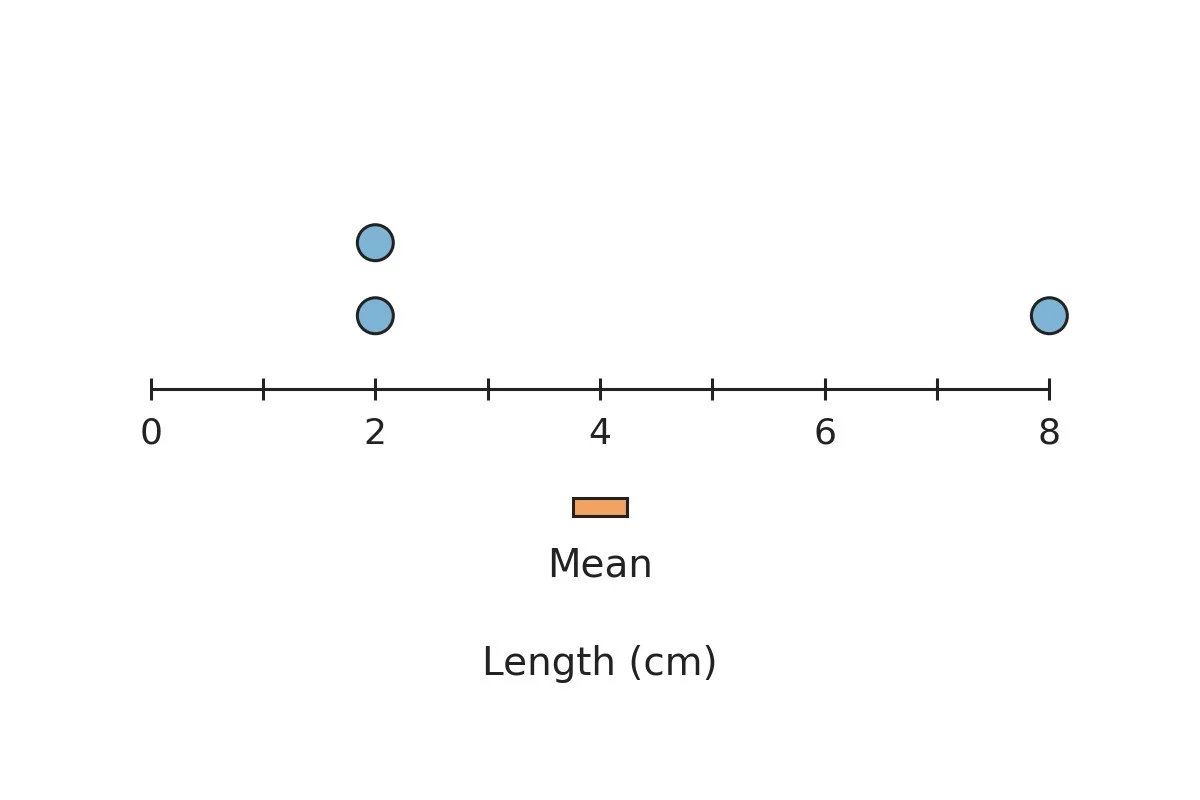
Two dots above 2, one above 8, and a separate mean marker below 4.

2. Dot plots

Each dot records one observation.

Show
Look at the diagram; cover the mean marker with paper. Point to both dots above 2, then the dot above 8.
Ask
If we shared the total length equally, what length would each observation receive?
Say
The three lengths total 12 cm, so sharing equally gives a mean of 4 cm. No recorded length needs to equal the mean.
Used in
Dot plots help workshops spot variation.
If your child says…“The mean must be one of the dots.”
Ask
When you uncover the mean marker, is there an observation above it?
What’s true
The mean can differ from every recorded value.

m=(2+4)−2+1+12+1m=\frac{(2+4)-2+1+1}{2+1}

m=63m=\frac{6}{3}

3. Mean

Divide the updated total by the updated count.

Show
Write these lines. Say m means the new mean. Explain that 2 becomes 1, then another 1 joins the record.
Ask
Starting with 2 and 4, will these two changes raise or lower the mean?
Say
After correcting 2 to 1, the mean is 2.5. Adding the extra 1 then lowers it to 2.
Used in
Correcting shop records keeps average sales figures useful for planning stock.
If your child says…“I only need to count the newly added value.”
Ask
Where have you allowed for replacing the original 2?
What’s true
Both the correction and the extra record affect the calculation.

2+2+x=3×32+2+x=3\times3

4+x=94+x=9

x=9−4x=9-4

4. Dot plots

Recover missing observations.

Show
Plot two dots at 2. Explain that three observations have mean 3, and x represents the missing value. Write the calculation after the prediction.
Ask
Where does the missing dot go?
Say
The missing dot goes at 5: subtract 4 from 9.
Used in
Average parcel weights help recover missing records.
If your child says…“Only the two visible dots count.”
Ask
How many dots will the completed plot contain?
What’s true
The required total includes the missing observation.

Read changes and patterns

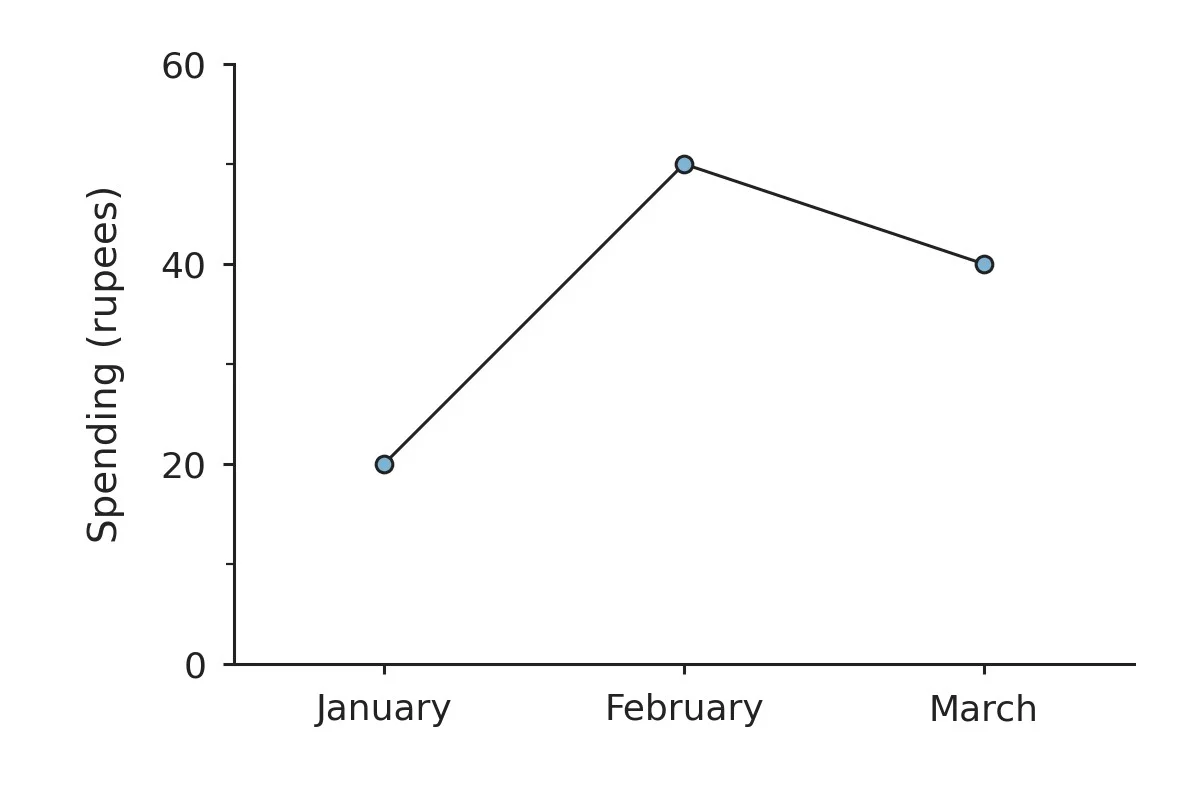
Line graph showing spending of 20 rupees in January, 50 in February and 40 in March.

5. Line graphs

Joined points show changes.

Show
Find each month's spending on the diagram. After predicting, trace the line to compare changes between neighbouring months.
Ask
Which neighbouring months show the larger change?
Say
January to February rises by 30 rupees.
Used in
Electricity graphs help households track consumption.
If your child says…“February is highest, so 50 is the change.”
Ask
How far apart are January's and February's readings?
What’s true
A change compares two readings rather than using either reading alone.
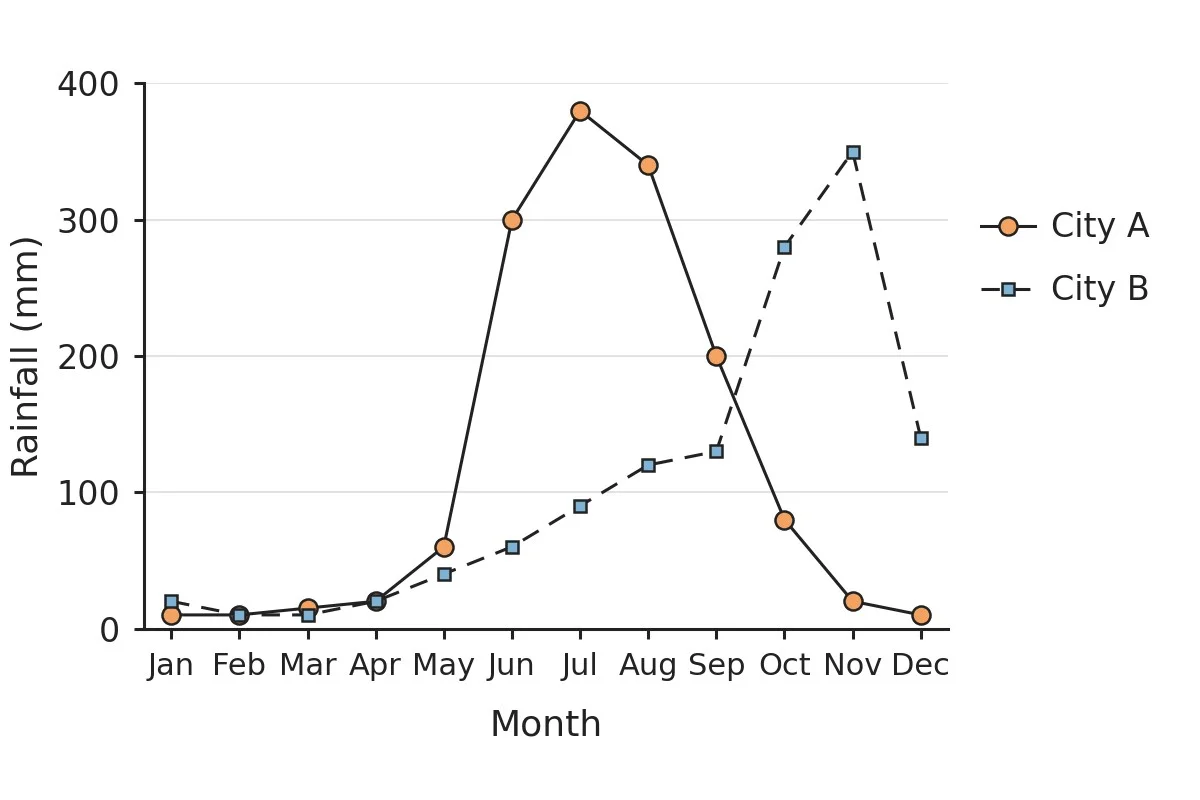
Line graph of monthly rainfall for two cities, with a key and labelled axes.

6. Catch the (Pattern in) Rain

Read each rainfall line separately and respect what its records show.

Show
Follow one city's rainfall line to its highest point. Read its month and rainfall from the axes.
Ask
If we examined that month's daily records, would they necessarily show rain every day?
Say
A monthly average cannot reveal which individual days had rain.
Used in
Seasonal rainfall patterns help communities plan water storage for drier periods.
If your child says…“The monthly average tells us it rained every day.”
Ask
Where does this graph give a separate reading for each day?
What’s true
A monthly summary does not provide each day's rainfall.

Read keys and scales

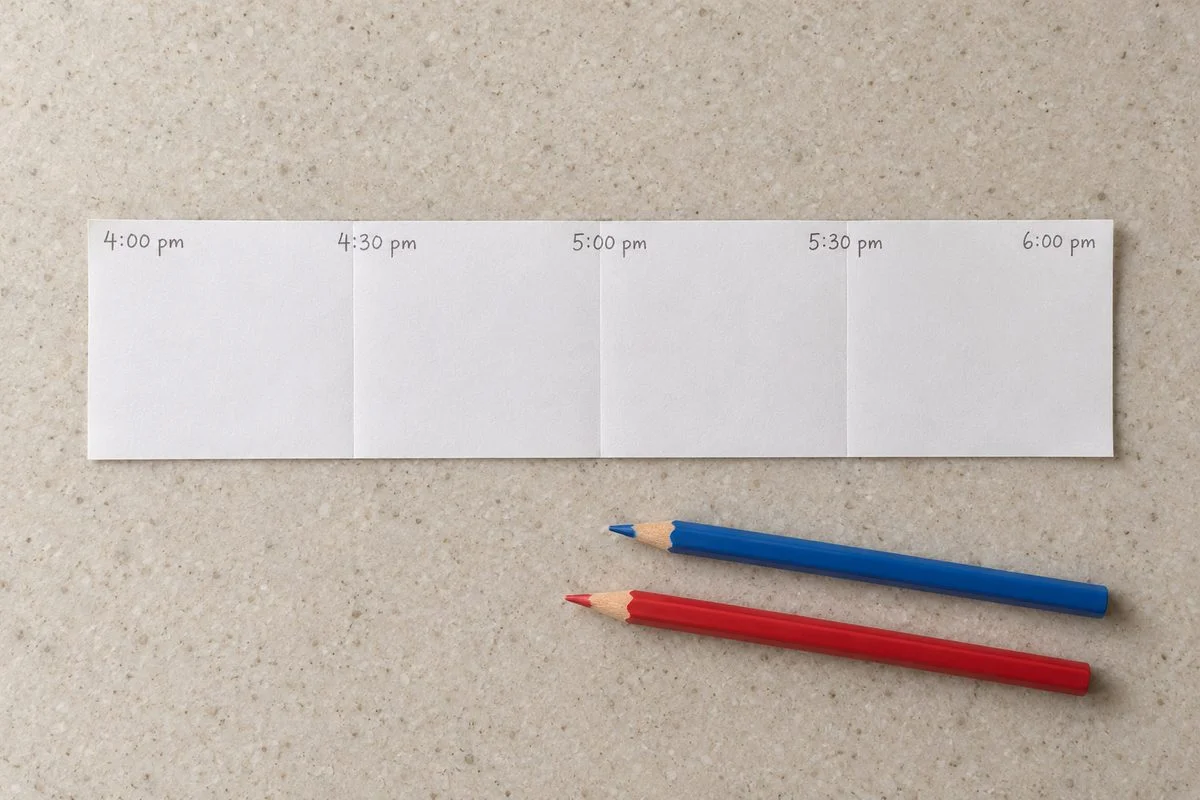
Four-cell folded paper strip with half-hour boundary labels beside two coloured pencils.

7. What can a Strip Say?

Read cells using their key.

Show
Fold four cells. Label boundaries 4:00, 4:30, 5:00, 5:30, 6:00 pm. Choose activity colours. After predicting, colour yesterday's main activities.
Ask
How many minutes would two matching cells record?
Say
Two cells record 60 minutes.
Used in
Time diaries help people plan activities.
If your child says…“Each cell means a whole hour.”
Ask
How much time passes between neighbouring boundary labels?
What’s true
The stated time scale determines each cell's duration.

D=(12−6) h+(18−12) h+30 minD=(12-6)\text{ h}+(18-12)\text{ h}+30\text{ min}

D=(6+6) h+30 minD=(6+6)\text{ h}+30\text{ min}

8. Sunrise and sunset times

Daylight runs from sunrise to sunset.

Show
Mark sunrise 06:00 and sunset 18:30 on a vertical time scale. Write these lines; D means daylight duration.
Ask
From 06:00 to 18:30, do you expect daylight to last more than twelve hours?
Say
Daylight lasts 12 hours 30 minutes.
Used in
Daylight duration helps walkers finish before dark.
If your child says…“Sunset at 18:30 means 18 hours 30 minutes of daylight.”
Ask
Does daylight begin at midnight or at the sunrise reading?
What’s true
A clock reading marks an event, while duration measures the time between events.

A real problem

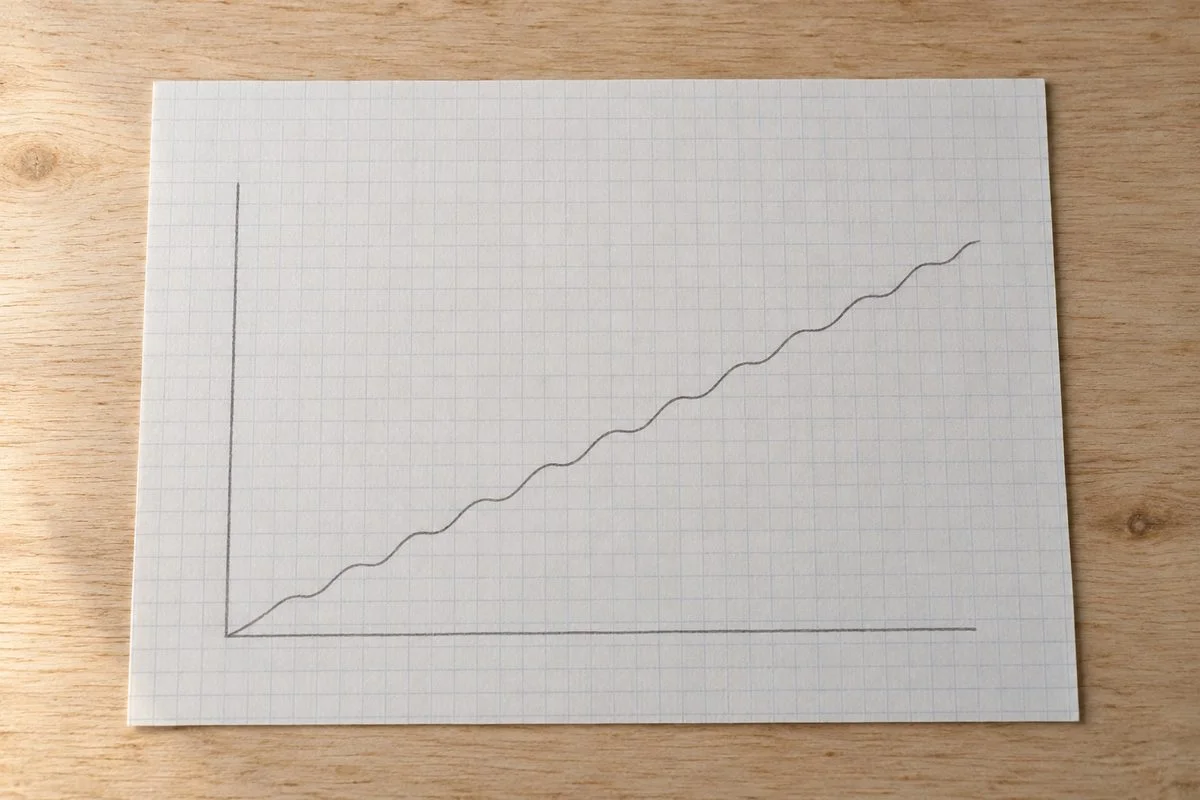
The Keeling Curve revealed rising atmospheric carbon dioxide.

Keeling began measuring atmospheric carbon dioxide at Mauna Loa Observatory in 1958.

Scientists report monthly averages of carbon dioxide levels for this curve.

The growing record revealed that atmospheric carbon dioxide was increasing year by year.

American Chemical SocietyScripps Institution of Oceanography

A pencil line graph that rises steadily with a small regular wiggle.

Concept Lab · Common misconception

The tempting mistake in Tales by Dots and Lines

Open standalone misconception page →

Can the average come from just the smallest and largest values?

Wrong

The mean of 2, 2, 2 and 10 is 6.

Why it feels right. I averaged the two endpoints on the plot.

Right

Every observation contributes to the mean.

Worked example

Three observations sit at 2 and only one sits at 10. The mean is 4, closer to the cluster.
  1. Place three dots at 2 and one at 10.
  2. The mean is (2 + 2 + 2 + 10) ÷ 4 = 4.

Ask your child eight quick questions.

One per step. The answer and the reason are given.

  1. What is the mean of the original pile counts?

    3 chickpeas. Sharing all nine chickpeas equally gives three in each pile.

  2. What is the mean of the three recorded lengths?

    4 cm. All three lengths count, including both observations measuring 2 cm.

  3. What mean results after both changes?

    2. The final values are 1, 4 and 1, totalling 6 across three records.

  4. How many observations determine the required total?

    Three. The stated mean belongs to the completed collection, including its missing observation.

  5. How much does spending fall from February to March?

    10 rupees. Compare 50 with 40 rather than reporting either month's spending.

  6. Can this graph identify the wettest day's date?

    No. The graph supplies monthly summaries, not separate daily records.

  7. How long does an activity covering all four cells represent?

    Two hours. Each cell represents half an hour, so four cells represent two hours.

  8. How much daylight lies between these sunrise and sunset readings?

    12 hours 30 minutes. Count from 06:00 to 18:30, rather than from midnight.
15 more questions with answers, 15 with pictures