Skip to content

Teach Connecting the Dots in eight steps.

For each idea: show it, ask before you tell, then say one line.

Gather spoons, a ruler, chickpeas, bowls, scrap paper, squared paper and five used pencils.

Common misconceptions & worked visual for this chapter · 15 practice questions with answers

How to teach it

Ask questions and find averages

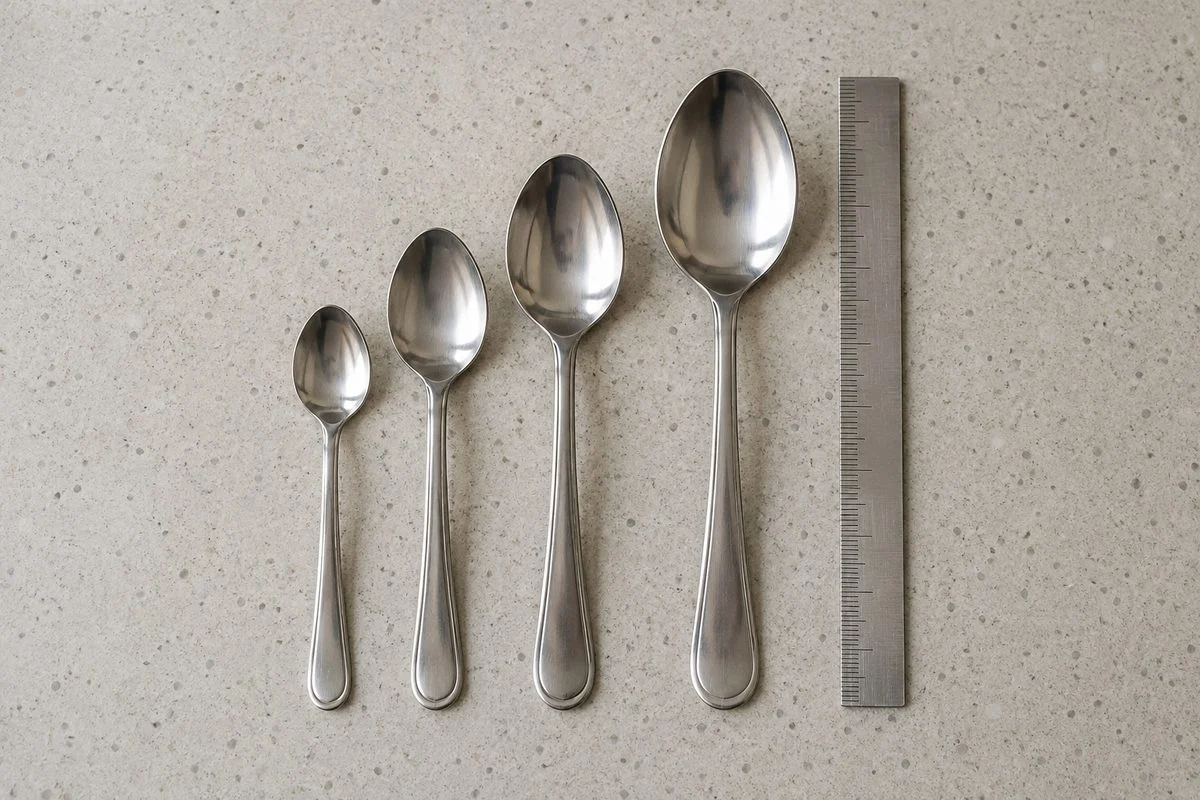
Four different-sized kitchen spoons aligned beside a ruler.

1. Of Questions and Statements

Statistical questions expect answers that vary across observations.

Show
Line up four different-sized kitchen spoons. Compare their lengths. After predicting, measure each to the nearest centimetre. Count those longer than 15 cm.
Ask
Will measuring one spoon settle how long all these spoons are?
Say
Different lengths need separate measurements. Your count above 15 cm makes a statistical statement about this collection.
Used in
Collecting classmates' reading preferences helps a library choose books.
If your child says…“Any question with a number answer is statistical.”
Ask
Does measuring just this spoon require collecting different answers?
What’s true
A statistical question expects variation in the observations collected.
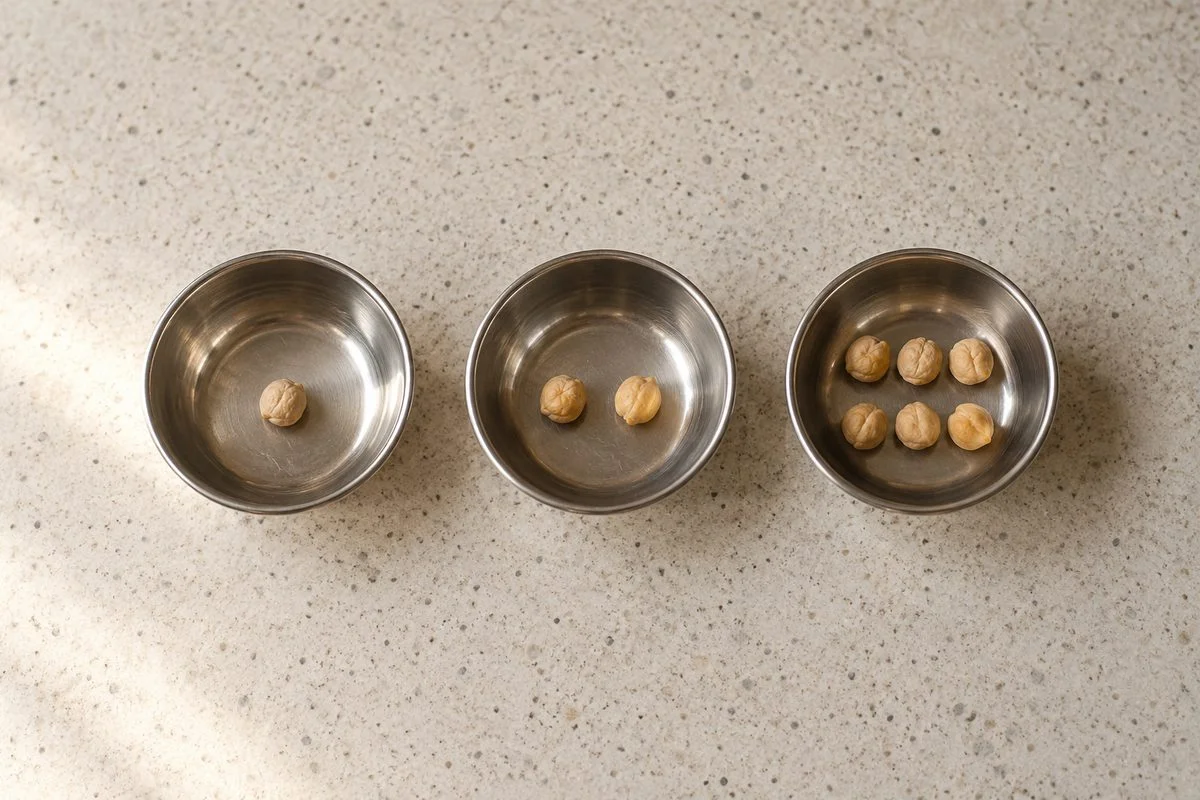
Three steel bowls holding one, two and six chickpeas.

2. Average as Fair-Share

The mean is each share when the total is divided equally.

Show
Put 1, 2 and 6 chickpeas into separate bowls. Count the total. After predicting, redistribute them equally.
Ask
How many chickpeas will each bowl get?
Say
Each bowl gets 3: the total divided by the bowl count. This equal share is the mean.
Used in
Average daily water use helps households compare consumption across periods of different lengths.
If your child says…“The mean can be bigger than every starting pile.”
Ask
Are there enough chickpeas to give every bowl more than 6?
What’s true
The mean stays between the smallest and largest starting counts, including those endpoints.

Mean=0+22\text{Mean}=\frac{0+2}{2}

Mean=22\text{Mean}=\frac{2}{2}

3. Arithmetic Mean

Count actual observations, including zero, when finding the mean.

Show
Write the record 0, 2, —. Say, “The dash means no match played.” Circle both scores. Say, “Add the scores and divide by the number of matches played.” Write these lines.
Ask
What mean score do you predict when only matches played count?
Say
The mean is 1 run per match played. Zero counts as a score, but the dash does not.
Used in
Sports averages include scoreless appearances so performance summaries count every match played.
If your child says…“The dash counts as another zero.”
Ask
Did the player play a match where the dash appears?
What’s true
Here, the dash records no participation, so it adds no match to the count.

Find the middle and spread

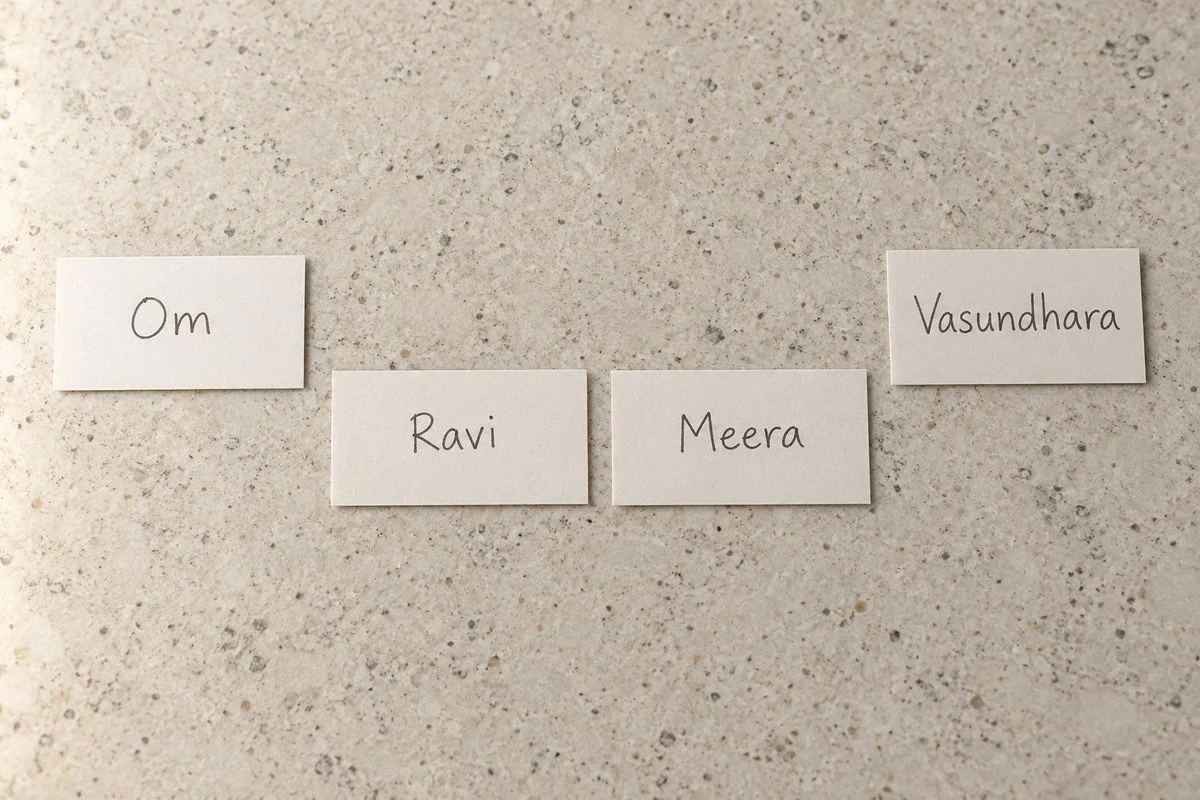
Four named paper slips with the outer pair moved aside.

4. Median

After sorting, take the middle value or average the middle pair.

Show
Write Ravi, Om, Vasundhara and Meera on separate slips. Count each name's letters. Sort by these counts. Slide the outer slips aside.
Ask
What median do you predict from the two remaining letter counts?
Say
The median is 4.5, halfway between the middle counts.
Used in
Median delivery times describe the middle of recorded waits, helping customers judge a typical wait.
If your child says…“The median is halfway between the smallest and largest.”
Ask
Which slips remain after removing the outer pair?
What’s true
The median uses central positions after sorting, rather than the extreme values.

Mean after=4+4+4+4+245 cm\text{Mean after}=\frac{4+4+4+4+24}{5}\text{ cm}

Mean after=8 cm\text{Mean after}=8\text{ cm}

5. Outliers

Unusually distant values can affect averages differently.

Show
Write five lengths of 4 cm. Say, “Their mean and median are both 4 cm.” Change the last length to 24 cm, then write the new mean.
Ask
What median would describe most lengths after the last measurement changes to 24 cm?
Say
The median stays 4 cm, matching most lengths. The mean rises to 8 cm because the total increases.
Used in
Median household spending helps describe typical spending despite unusually large purchases.
If your child says…“An unusual length changes the mean and median equally.”
Ask
Which value occupies the middle after the replacement?
What’s true
Changing an extreme value can change the total while leaving the middle value unchanged.
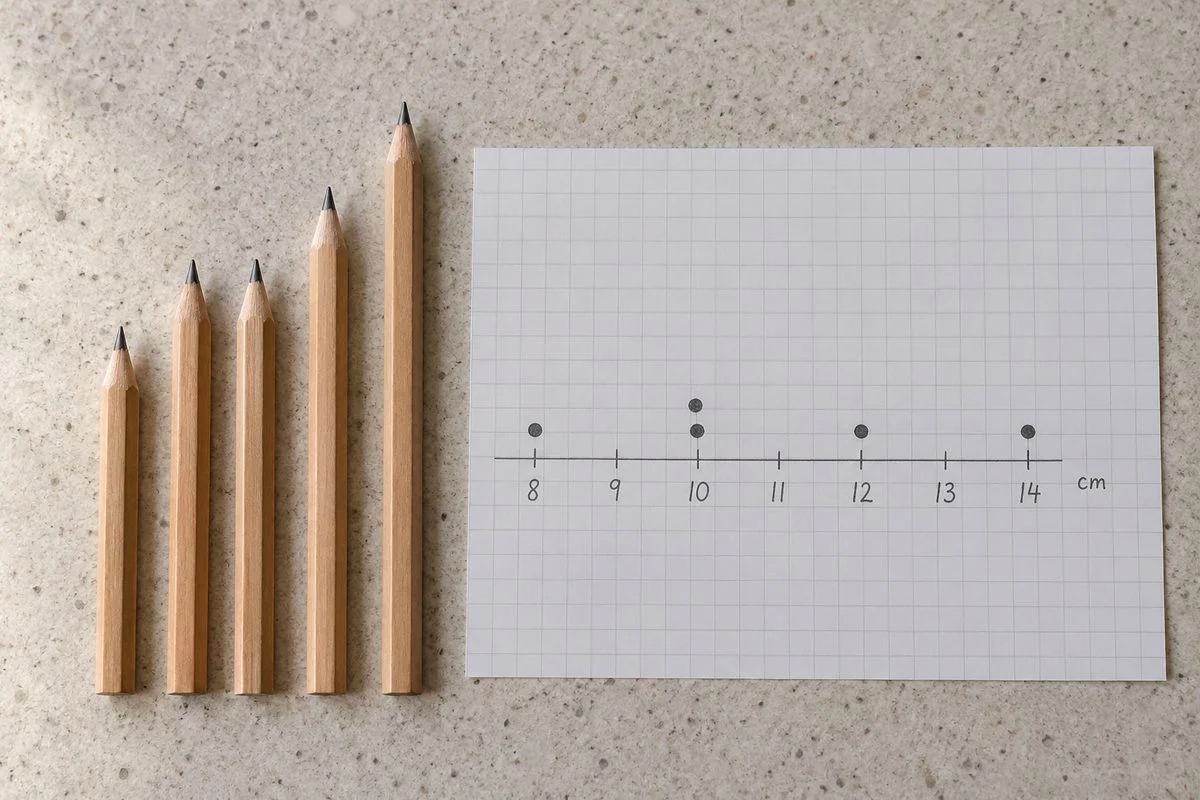
Five used pencils beside a dot plot with a numbered centimetre line.

6. Of Ends and the Essence

Dots show counts and clusters; range measures the gap between extremes.

Show
Measure five used pencils, recording centimetres in measuring order. On squared paper, plot each length above a numbered line, stacking matching dots. Subtract the shortest length from the longest. Cover the list.
Ask
Will the dots alone reveal which pencil you measured first?
Say
The range measures the gap between shortest and longest. Unlabelled dots show repeated lengths, but lose the measurement order.
Used in
Delivery-time ranges reveal how widely waiting times vary, helping customers allow enough time.
If your child says…“Each dot still tells me which pencil it came from.”
Ask
What on a dot identifies the pencil measured first?
What’s true
Without identifying labels, the dots retain lengths and counts but lose each pencil's identity.

Read graphs and judge claims

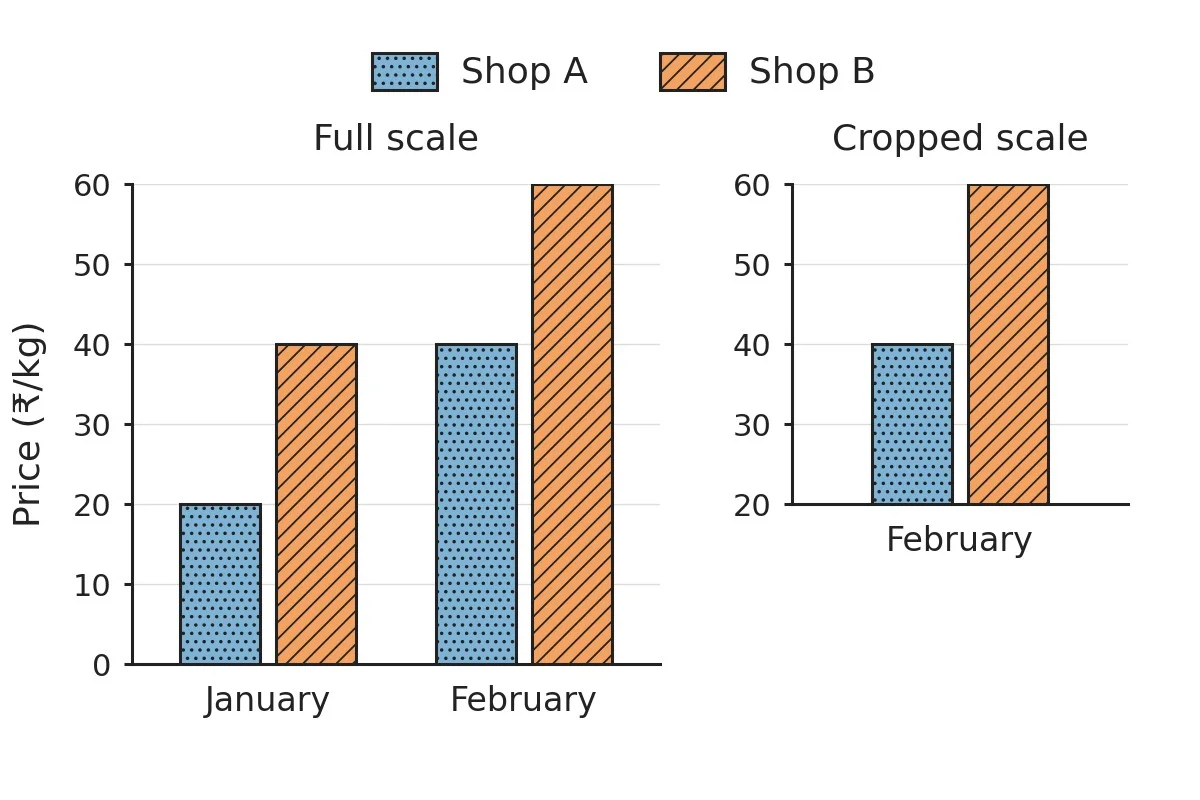
Shop prices on full and cropped scales, with dotted and striped bars.

7. Clubbing the Columns

The key identifies shops, and the scale shows their prices.

Show
Look at the diagram's key, then follow Shop A from January to February. Compare February's bars on the full and cropped scales.
Ask
Before reading the cropped scale, what February prices do you predict it will show?
Say
February's prices are 40 and 60 rupees per kilogram. The cropped scale starts at 20. Its bar lengths compare amounts above 20, not whole prices.
Used in
Rainfall graphs help gardeners compare seasons across places.
If your child says…“A bar twice as long always means twice the amount.”
Ask
Is 60 twice 40 when B's visible bar is twice as long as A's?
What’s true
Visible lengths give value ratios only on the same linear scale starting at zero.

Combined mean=2+6+3+3+32+3\text{Combined mean}=\frac{2+6+3+3+3}{2+3}

Combined mean=175\text{Combined mean}=\frac{17}{5}

8. Data Detective

Check individuals, group sizes and missing data before accepting claims.

Show
Say, “A's two pupils score 2 and 6. B's three pupils each score 3. A's mean is 4, and B's mean is 3. Combine everyone's scores, then divide by the total pupil count.” Write this line.
Ask
What combined mean comes next?
Say
The mean is 3.4: every pupil counts once. A includes the lowest score.
Used in
Combining class reading records fairly helps a school plan its library.
If your child says…“I'll take halfway between the group means.”
Ask
Should the group of three pupils count more than the group of two?
What’s true
Combine the groups' totals and counts before dividing.

A real problem

Death records supported hospital reform.

Nightingale's statistical analyses accompanied the Royal Commission's findings in 1858.

Her diagram identified infectious disease as the main cause of soldiers' deaths.

Her diagrams provided evidence for changes in patient care.

Science Museum GroupNational Army Museum

Clean hospital ward with neatly made beds and open windows.

Concept Lab · Common misconception

The tempting mistake in Connecting the Dots

Open standalone misconception page →

Which group has the higher average?

Wrong

The group with the larger total always has the larger mean.

Why it feels right. A larger sum looks like stronger performance.

Right

Mean is total divided by the number of observations.

Worked example

A · total 15, mean 5
5
5
5
B · total 14, mean 7
7
7
Each tile is one score. Group A has more scores, but each score in Group B is higher.
  1. Scores 5, 5, 5 total 15 and average 5.
  2. Scores 7, 7 total 14 and average 7.

Ask your child eight quick questions.

One per step. The answer and the reason are given.

  1. Why collect several measurements to describe the lengths of our spoons?

    Their lengths can differ. The question concerns a collection whose measurements may vary.

  2. Could equal sharing give every bowl more than 6 chickpeas?

    No. The unchanged total cannot give every bowl more than the largest starting count.

  3. How many matches count in this record?

    2 matches. Both numerical scores count, including zero.

  4. Which letter counts determine our median?

    4 and 5. These occupy the central positions after sorting.

  5. Which increases after this replacement: the mean or the median?

    The mean. The total increases while the middle value remains 4 cm.

  6. Can these dots tell you which pencil you measured first?

    No. Dots retain lengths and counts, but omit the recording order.

  7. What is Shop B's February price on the cropped scale?

    60 rupees per kilogram. Cropping changes the visible length, not the price recorded.

  8. Why can't we average 4 and 3 directly here?

    The group sizes differ. Each pupil needs equal weight, not each group.

15 more questions with answers, 3 with pictures